Research
My atmospheric physics research has been directed towards obtaining
a better understanding of electrical discharges within the atmosphere.
I have developed both hardware and low-level software to collect data
and have written several high-level software programs to analyze that
data. What follows is a brief chronological summary of some key
results I have obtained. More detailed information can be found in
some of my publications and
on other web pages.
1994
During the summer of 1994 at Langmuir Lab,
our interferometer observed triggered lightning for the first time:
 |
On the last day of operations, a 47-stroke triggered lightning
discharge was observed with our interferometer system (Note: a normal
cloud-to-ground (CG) discharge averages between 3-4 strokes!) The
upward-going positive leader which was launched from the triggering
rocket was not visible at radio-frequencies (RF). However,
recoil-like events were observed propagating back towards the ground
along channels through which the positive leader had passed. These
events are similar to recoil events seen in intracloud as well as some
CG discharges. An azimuth/elevation plot of the discharge is shown at
left, with the trigger site at the lower right (the lightning
propagated away towards a distant storm at low elevation angle in the
lower left). |
Additional analysis of 1994 data (in 1995) increased our
understanding of how lightning relates to storm structure:
 |
In collaboration with Chip Scott, a fellow graduate
student at New Mexico Tech, lightning images obtained by our
interferometer during the summer of 1994 at Langmuir Lab
were overlayed onto the RHI (vertical) scan planes of a
dual-polarization radar situated at New Mexico Tech. This study
revealed an apparent close correlation of the discharges with high
reflectivity regions throughout the storm (left figure) as well as
with the vertically-aligned ice crystals in an inferred strong
electric field region in the upper portion of the storm (right
figure). |
 |
On September 2, 1994, 3-dimensional lightning images obtained
by the Kennedy Space Center Lightning Detection and Ranging
(KSC LDAR) system, operated then by Carl Lennon and Launa Maier, were
correlated with PPI (horizontal) NEXRAD radar scans through a
thunderstorm developing over KSC. There is a close correlation between
the lightning channels and the regions of highest reflectivity. This
correlation supports the precipitation-based theory for thunderstorm
charging. As the storm developed, the lightning became more
complex. At the level of the negative charge layer (about 8 km
altitude), lightning would often propagate from newer cells into older
ones. One such discharge is shown in the neighboring figure. This
particular discharge was initiated near the core of the cell just
below center in the figure, produced a channel to ground, and launched
horizontal channels into an older cell in the upper-right of the
figure. |
 |
 |
The occurrence of downbursts during the storm development on
Sept. 2, 1994 was analyzed. The picture to the left shows lightning
activity preceeding a downdraft of air at the ground. Note the close
correlation between the plan position of the lightning (white) and the
center of the subsequent downdraft (located halfway between the
maximum velocity toward (purple) and away (yellow) from the radar).
Lightning activity typically lead the occurence of downbursts by 6-10
minutes and was well correlated in plan position with them. |
1995
In 1995, the interferometer underwent one of the biggest upgrades in
its history:
- In late 1994, a new VME-based analog-to-digital (A/D) converter
board was designed at New Mexico Tech. In early 1995,
four A/D boards were assembled, their EEPROM and GAL chips were
programmed, and the completed boards were thoroughly tested.
-
A VME-based Sonitech Dual-DSP (TI 320C40) board was used
to process data output from the A/D boards. A real-time data
acquisition program was written almost entirely in assembly
language for the DSPs. A program was written in C on a Sun
Sparc-station to interface with the DSPs, acquire the data,
and display it real time. The whole system acquired its first
data in late August. |
 |
- A vertical baseline was added to the 2 orthogonal horizontal
baselines used by the old system. Once operational in early
September, the vertical baseline expanded the range of the
interferometer to beyond 50 kilometers (from a previous maximum
range of about 20 km).
1996
In 1996, I finally began researching what would become one of the
main topics of my dissertation: sprites.
 |
Less than a week after our first sprite observations,
spectacular images of close sprites were obtained on July 25,
1996. The animation to the left shows one of several examples
obtained that night of fine dendritic streamer structure in
sprites. The carrot sprite (so named because of a dramatic
upward carrot shape) is followed by a slow upward-moving event
within the body of the sprite. The tendrils, which ordinarily
are seen branching downwards from carrot sprites, were obscured
by a foreground cloud at the bottom of these images. |
| In 1996, a sferic-recording mode was implemented on our data
acquisition system. One significant discovery was that
energetic sprites were often accompanied by a slow electric
field change, suggesting that the sprites themselves were
conducting significant amounts of current. The plot to the
right shows the red light produced by a sprite (plotted in red)
compared with the electric field (plotted in green). The strong
correlation between the curves clearly shows that the sprite was
responsible for the field change (Note: the photometer trace was
provided by Walt Lyons and Tom Nelson of FMA Research.) |
 |
1997
In the early summer of 1997, I obtained the first simultaneous
VHF-imagery of sprite-producing discharges accompanied by video of the
sprites.
 |
The plot to the left view shows a sprite-producing discharge
viewed from above with contours marking increasing levels of
radar reflectivity and the discharge progression color-coded
from blue to red with respect to time. The discharge originated
in a convective core on the right side of the image and
propagated towards the upper left into the stratiform region.
The discharge was almost fully horizontally developed when it
produced a +CG which in turn produced sprites above the
discharge. The grid squares in the image are 25 km on a side.
It is clear from this scale that sprite-producing discharges are
much larger than ordinary discharges. |
In the early fall of 1997, I obtained the first successful high
speed video imagery of sprites.
| The animation to the right shows a portion of a 1000
frames/second high speed video sequence of a carrot sprite and
some fainter column sprites. These were the first sprites to be
successfully captured with a high speed video camera. This and
numerous other high speed video sequences which followed clearly
showed that sprites were initiated at high altitude (about 75
kilometers) and were composed of high-velocity streamers.
Results from the high speed video study were highlighted in three different
publications and in Science News. |
 |
1998
In 1998, the first daytime sprites were detected via their unique
sprite ELF signature.
 |
On August 14, 1998, three energetic daytime sprite events were
detected via their ELF fingerprint. The sprite events were
associated with exceptionally energetic positive cloud-to-ground
(+CG) discharges in southern Texas at >1000 km range from the
detector. The electric field waveform of the first event is
shown at left. A fast positive pulse, the +CG return stroke, is
immediately followed by a large slow positive field change
produced by a very large continuing current to ground. The
second slow field change is not immediately preceeded by any
fast pulses, giving away its true nature as a sprite field
change. The daytime sprite events were published (and featured)
in GRL (see publications) and were also highlighted in American Scientist. |
Another first in 1998 was the detection of sprites associated with
negative cloud-to-ground discharges.
| In collaboration with Stanford University, the first sprites
associated with -CGs were detected on August 29, 1998. The
electric field waveform of the first sprite-producing -CG is
shown at right. Unfortunately, all but the upper portion of the
sprites (not shown) were blocked by clouds, so no one yet knows
how -CG sprites compare visually to more common +CG ones. |
 |
1999
In 1999, an energetic positive-bipolar event was found to be
preceeded by a slow static field change with no detectable VHF
emissions.
On August 2, 1999, the Los Alamos Sferic Array (LASA) located a positive
bipolar event only a few kilometers to the south of my electric field
instrument, which was stationed at my house in Lemitar, NM. The
electric field instrument detected the onset of a slow field change a
full 30 milliseconds prior to the first detected VHF radiation from
the discharge. Though slow electric field deflections without VHF are
a common occurrence in rocket-triggered lightning (see 1994 results above), this is
the first time that such behavior has been seen in more ordinary
lightning. To make matters more interesting, the first VHF radiation
produced was many orders of magnitude more powerful than that
typically emitted by lightning and this radiation was associated with
an energetic positive bipolar event.
2000
In 2000, I operated the NMT interferometer/sferic system as part of
the STEPS research program:
The interferometer/sferic system acquired data at a location near
the center of the STEPS campaign
research area between May 25 and August 13, 2000. A very large amount
of data was collected and placed on 222 CDROMs (about 130 GB). In
addition, video data was collected of storm development and lightning
discharges. The interferometer, sferic, and video data of select
lightning discharges will be analyzed in detail and will also be
compared to data obtained by other systems such as the 3-dimensional
NMT
Lightning Mapping Array.
2001
In 2001, the interferometer was operated from a site just a few
kilometers north of Arecibo Observatory, Puerto Rico:
 |
The interferometer/sferic system was set up in Dominguito,
Puerto Rico, just a few kilometers north of Arecibo Observatory.
The Puerto Rico campaign was a joint effort between Penn State,
New Mexico Tech, and Stanford. The purpose of the Puerto Rico
campaign was two-fold: to search for ionospheric effects due to
lightning and to compare the VHF (interferometer) development of
lightning with that observed by radar (Arecibo 430 MHz UHF). An
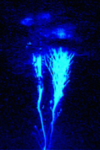
unexpected result from the campaign which occurred on the last
night of observations was the video documentation of a blue jet
event which reached up from a thundercloud top all the way to
the ionosphere. This event was highlighted on the cover of Nature. The blue jet was captured with the
assistance of a blue-sensitive ITT Night Vision GEN-III
intensifier and was also documented via electric field data
obtained by the sferic system. A false-colored image of the
event is shown at left. |
2002
I started working at Los Alamos National Laboratory in 2002.
Initially, I was involved with the FORTE project:
In an attempt to model the complex gain and phase pattern of the
log-periodic FORTE antennas, I ran Numerical Electromagnetics
Code (NEC) simulations in parallel across a large number of computers.
The modeled response was then used on a large database of events to
obtain an estimate of the power spectral behavior of lightning at VHF
and to quantify how it varied between different types of discharge
processes.
2003
As part of a collaborative effort, I analyzed electric field data
acquired of energetic close discharges during STEPS 2000:
A collaborative effort was initiated by Walt Lyons in which 3D Lightning Mapping Array (LMA) data was analyzed
along with electric or magnetic field change data of sprite-producing
discharges over the STEPS 2000 region. I used 3D LMA data along with
close electric field data collected in 2000 to obtain the charge
moment change estimates of these discharges. These estimates were
then compared with remote magnetic field measurements acquired by
Steve Cummer. There was general agreement between our estimates,
albeit with a systematic percentage offset which is still not
completely understood.
I analyzed historical data from the Los Alamos Sferic Array (LASA)
in Florida:
I used a database of tower locations and heights to explore the
possibility that large charge moment change lightning discharges were
systematically launching upward leaders from tall towers. Using a few
years of lightning data in Florida, it was found that towers of 400
meter height or greater have a high risk of launching an upward leader
in the presence of a large charge moment change discharge.
2004
I developed data acquisition, retrieval, and analysis software for
the new LASA and helped deploy the new stations in Florida:
The 2nd generation LASA system was developed using the 20MHz @12-bit Measurement Computing PCI-DAS4020
board. I wrote the data acquisition code for the board. The
features of the system were as follows:
- Sub-microsecond time resolution using 1 PPS on channel 0
- Versatile triggering scheme as independent or slaved to another channel
- Configurable pre/post trigger lengths on up to 4 channels
- Capable of very high trigger and data rates
- No dead-time between triggers
- Resolution of up to 16-bits via software summation of raw 12-bit data
- Remotely operated and very stable
In addition, I wrote software which automated the task of
retrieving the massive amounts of data collected by each station.
Well over a terabyte of data had been retrieved over the internet in
less than a year after initial deployment in April, 2004. I also
wrote analysis software in IDL for the new data set.
I was involved in numerous programmatic activities:
Since many of these activities are classified, I can not discuss
them further. However, I can say that they were very time consuming.
2005
LASA was extended into the Great Plains of the United States in
April, 2005:
I helped deploy the new Great Plains Network addition to LASA in
April, 2005. I also made some minor modifications to the acquisition
code in order to accomodate some new hardware configurations for the
new array, including an experimental photometer setup at one of the
sites. Within a month after initial deployment, I had dropped the
bipolar trigger thresholds to an unprecedented sensitivity of <0.2
V/m.
I analyzed LASA data around the times of terrestrial gamma-ray
flashes (TGFs) detected by the RHESSI satellite:
Using LASA data from 2004 and 2005, I found several RHESSI
TGFs which were sufficiently close (<1100 km) to one or more
stations that I was able to resolve whether or not the coincident
discharge was an intracloud or cloud-to-ground. In all cases, they
were intraclouds. Furthermore, a couple of events were sufficiently
close and impulsive that I was able to obtain source altitudes using
ionosphere reflection pairs. These and other analysis results were
recently published in a GRL article (see my publications).
Last modified: March 27, 2006